Step by Step Instructions for Easy EXCEL Dashboards
By David Wetton
x
Showing posts with label PivotTables. Show all posts
Showing posts with label PivotTables. Show all posts
Saturday, April 9, 2016

Introduction to Pivot Tables, Charts, and Dashboards in Excel
By Jon Acampora of ExcelCampus.com
Part 1
How to create an interactive dashboard using Pivot Tables and Pivot Charts.
Works with Excel 2003, 2007, 2010, 2013 for Windows & Excel 2011 for Mac
Download file used in the video
Part 2
In this video I explain some of the different pivot table calculation types. Learn how to calculate the average, count, sum, and percentage of total. I explain how to update your pivot table with more data, and also how to refresh your pivot tables.
The video contains a lot of Excel tips, like how to quickly make a duplicate copy of a sheet, how to select the visible cells only, and a lot of useful keyboard shortcuts.
Download file used in the video
Part 3
This is part 3 in the series on Pivot Tables and Dashboards. In this video we bring it all together to create the interactive dashboard.
You will learn how to:
- Group dates into months and years to create a time series trend chart.
- Group amounts to create a distribution (histogram) chart.
- Add slicers to your pivot tables and charts to make them interactive.
- Lots of tips and shortcuts for formatting your charts.
Download file used in the video
Part 1
How to create an interactive dashboard using Pivot Tables and Pivot Charts.
Works with Excel 2003, 2007, 2010, 2013 for Windows & Excel 2011 for Mac
Download file used in the video
Part 2
In this video I explain some of the different pivot table calculation types. Learn how to calculate the average, count, sum, and percentage of total. I explain how to update your pivot table with more data, and also how to refresh your pivot tables.
The video contains a lot of Excel tips, like how to quickly make a duplicate copy of a sheet, how to select the visible cells only, and a lot of useful keyboard shortcuts.
Download file used in the video
Part 3
This is part 3 in the series on Pivot Tables and Dashboards. In this video we bring it all together to create the interactive dashboard.
You will learn how to:
- Group dates into months and years to create a time series trend chart.
- Group amounts to create a distribution (histogram) chart.
- Add slicers to your pivot tables and charts to make them interactive.
- Lots of tips and shortcuts for formatting your charts.
Download file used in the video
Tuesday, April 5, 2016
Pivot Charts Excel 2010
Pivot Charts
A pivot chart is a graphical representation of a data summary displayed in a pivot table. A pivot chart is always based on a pivot table. Although Excel lets you create a pivot table and a pivot chart at the same time, you can’t create a pivot chart without a pivot table. All Excel charting features are available in a pivot chart
Pivot charts are available under Insert tab » PivotTable dropdown » PivotChart
Pivot Chart Example
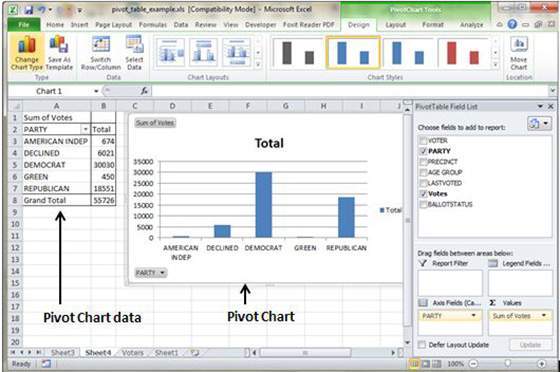
Now let us see Pivot table with the help of example. Suppose you have huge data of voters and you want to see summarized view of the data of voter Information per party in the form of charts then you can use Pivot chart for it. Choose Insert tab » Pivot Chart to insert pivot table.

MS Excel selects the data of the table.You can select the pivot chart location as existing sheet or new sheet. Pivot chart will depends on automatically created pivot table by the MS Excel. You can the the generated pivot chart in the below screen-shot
From TutorialsPoint.com...
A pivot chart is a graphical representation of a data summary displayed in a pivot table. A pivot chart is always based on a pivot table. Although Excel lets you create a pivot table and a pivot chart at the same time, you can’t create a pivot chart without a pivot table. All Excel charting features are available in a pivot chart
Pivot charts are available under Insert tab » PivotTable dropdown » PivotChart
Pivot Chart Example
Now let us see Pivot table with the help of example. Suppose you have huge data of voters and you want to see summarized view of the data of voter Information per party in the form of charts then you can use Pivot chart for it. Choose Insert tab » Pivot Chart to insert pivot table.
MS Excel selects the data of the table.You can select the pivot chart location as existing sheet or new sheet. Pivot chart will depends on automatically created pivot table by the MS Excel. You can the the generated pivot chart in the below screen-shot
From TutorialsPoint.com...
Friday, March 25, 2016
Pivot Tables in Excel 2010
Pivot tables
A pivot table is essentially a dynamic summary report generated from a database. The database can reside in a worksheet (in the form of a table) or in an external data file. A pivot table can help transform endless rows and columns of numbers into a meaningful presentation of the data. Pivot table are very powerful tool for summarized analysis of the data.
Pivot tables are available under Insert tab » PivotTable dropdown » PivotTable
Pivot Table Example
Now let us see Pivot table with the help of example.Suppose you have huge data of voters and you want to see summarized data of voter Information per party then you can use Pivot table for it. Choose Insert tab » Pivot Table to insert pivot table. MS Excel selects the data of the table.You can select the pivot table location as existing sheet or new sheet.

This will generate the Pivot table pane as shown below.You have various options available in Pivot table pane as below. You can select fields for the generated pivot table.

- Column labels : A field that has a column orientation in the pivot table. Each item in the field occupies a column.
- Report Filter : You can set the filter for the report as year then data gets filtered as per the year.
- Row labels: A field that has a row orientation in the pivot table. Each item in the field occupies a row.
- Values area : The cells in a pivot table that contain the summary data. Excel offers several ways to summarize the data (sum, average, count, and so on).
Read more on tutorialspoint.com...
Subscribe to:
Posts (Atom)